
Resume Ground resources
Data analyst resume example
A practical Indian data analyst resume format, with sample statements for freshers and experienced applicants.
The button opens the existing template and role-starter flow. Where no matching starter exists, start blank and copy suitable statements below.
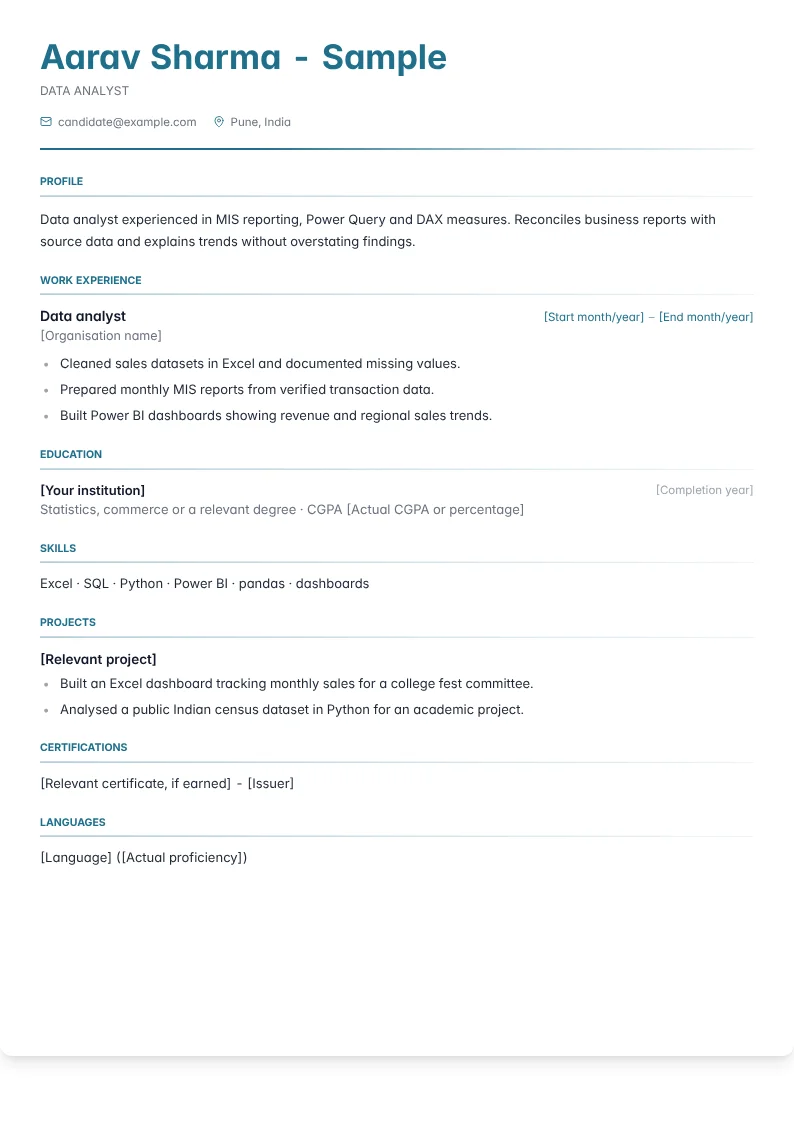
Sample resume, not a real candidate
Aarav Sharma is fictional. Institution, organisation, grades and date fields are placeholders. Replace them with your real details. This is the Modern Clean layout.
Lead with the decision your analysis supported
A data analyst application becomes clearer when it begins with business questions rather than software names. Explain whether your work helped examine customer behaviour, reconcile operations, monitor financial activity, or understand another defined process. Recruiters in India may screen for SQL, spreadsheet competence, a reporting platform, and familiarity with the employer's domain. Hiring managers also need to know whether you can turn an unclear request into a defensible analysis. Name the audience, the question, and the limits of the available data. A dashboard is an output, not the whole contribution. Your evidence should show how you decided what to measure and how you helped someone interpret the result without overstating certainty.
Make data handling visible before visual polish
Describe how you established the meaning and grain of the records before calculating a metric. Useful details include checking duplicate entities, reconciling sources, handling missing values, and confirming whether a date represents creation, completion, or posting. SQL experience is stronger when you explain the analytical purpose of joins, aggregations, or window functions rather than merely listing them. For spreadsheet work, identify the model or recurring task and the checks that kept it dependable. Reporting tools should be connected to filter behaviour, metric definitions, and refresh assumptions. A reviewer should understand what you did when the data disagreed with expectations, including when you sought clarification instead of quietly choosing a convenient interpretation.
Demonstrate business reasoning in a portfolio
Build a case study around a question that can actually be answered with the available dataset. State its source, explain cleaning decisions, define the measures, and separate observations from recommendations. Public datasets often lack operational context, so acknowledge what cannot be inferred. Freshers can use this format to demonstrate analytical discipline without claiming commercial impact. Experienced analysts should emphasise stakeholder alignment, recurring reporting ownership, and occasions when they challenged an ambiguous request. A portfolio can include a query file, a workbook, and a short interpretation memo rather than only dashboard images. Tool certifications are optional corroboration; provide one if the vacancy asks for it. Remove personal or commercially sensitive records before sharing any employment related example.
Replace dashboard duties with analytical contribution
Consider this hypothetical bullet revision for recurring operational reporting. • Before: Prepared sales dashboards and analysed business data using SQL. • After: Reconciled order and refund records in SQL, documented the treatment of cancelled orders, and built a sales dashboard with agreed definitions for booked and realised revenue. The revised wording identifies a real analytical difficulty: apparently similar measures can answer different questions. It avoids claiming that the report caused revenue growth. Use such wording only when you performed the reconciliation and definition work. If your role was limited to visual implementation, describe that accurately. In an interview, be ready to explain join keys, exclusion rules, stakeholder signoff, and how the report made its assumptions visible to readers.
Catch four errors before a recruiter does
First, presenting a chart without defining its denominator can make the apparent insight misleading. Second, treating correlation as evidence of causation overreaches what descriptive analysis can establish. Third, sharing a polished workbook with broken references or unexplained manual adjustments weakens reproducibility. Fourth, quoting business impact without knowing how it was attributed creates an avoidable credibility problem. Review each example for these issues. Keep a compact record of assumptions and validation checks so you can defend the work without memorising a script. Where evidence is incomplete, state the uncertainty and propose the next analysis. Clear limits are part of sound judgement, especially when a stakeholder wants a confident answer that the available records cannot support.
Prepare for practical analytical screening
Indian analyst hiring may involve a spreadsheet exercise, SQL questions, a business case, or a discussion of a report you produced. Prepare to explain your approach aloud: clarify the question, inspect the records, choose a metric, validate the calculation, and communicate the conclusion. Do not jump straight to chart selection. Match your resume vocabulary to the vacancy while retaining the distinctions between reporting, exploratory analysis, and experimentation. Keep education, employment history, and availability consistent across application channels. Experienced applicants should explain how stakeholders used their work and how metric disagreements were resolved. Freshers should demonstrate careful reasoning with an unfamiliar dataset and show that they can communicate a qualified answer in plain language to a nontechnical colleague.
Arrange the evidence for this application
Start with the business domain, then analytical assignments and a selected reporting case. Add SQL and spreadsheet skills after the evidence they support. With little employment history, move a documented dataset investigation immediately after education. Keep its interpretation memo next to the dashboard link so the portfolio is not mistaken for visual design alone.
Key skills and tools
- Excel
- SQL
- Python
- Power BI
- pandas
- dashboards
Copy only statements that match your actual work. Replace bracketed metrics only with verified values, or remove the number. These suggested revisions are examples, not claims about a real candidate.
Fresher and project bullet examples
Built an Excel dashboard tracking monthly sales for a college fest committee.
Analysed a public Indian census dataset in Python for an academic project.
Cleaned duplicate customer records during a data analysis internship.
Created a Power BI attendance dashboard for a student club.
Compared survey responses using pivot tables for a college research project.
Wrote SQL queries to summarise sample retail orders in a portfolio case study.
Experienced bullet examples
Cleaned sales datasets in Excel and documented missing values.
Prepared monthly MIS reports from verified transaction data.
Built Power BI dashboards showing revenue and regional sales trends.
Analysed customer purchase patterns using SQL queries.
Validated Excel formulas against source invoices and sample records.
Wrote joins and aggregate queries for recurring business reports.
Reduced manual reporting time by [X]% using Power Query transformations.
Reconciled dashboard totals with ERP exports before circulation.
Reviewed [N] records for duplicate entries and inconsistent categories.
Documented reporting assumptions and data limitations for stakeholders.
Created DAX measures for budget and actual comparisons.
Explained changes in sales trends through annotated dashboard views.
Three summary examples
Data analysis fresher with Excel, SQL and Power BI project experience. Prepared dashboards and cleaned datasets for academic and student committee work.
Data analyst experienced in MIS reporting, Power Query and DAX measures. Reconciles business reports with source data and explains trends without overstating findings.
Analytics candidate with internship reporting work and prior experience in operations or another domain. Brings business context to Excel analysis, SQL extraction and dashboard validation.
Frequently asked questions
Do I need Python for every analyst role?
No. Follow the vacancy's emphasis. Strong SQL, spreadsheet work, and business interpretation may be more relevant than an unsupported Python claim.
Can I use a public dataset in my portfolio?
Yes. Attribute the source, respect its usage terms, and explain the missing business context and limits on your conclusions.
Should I include dashboard screenshots?
Use them alongside metric definitions and analytical commentary. A screenshot alone rarely shows whether the underlying analysis is sound.
How do I describe impact without business figures?
Describe the decision supported, ambiguity resolved, reconciliation completed, or reporting process clarified, using only outcomes you can substantiate.